About Afflux Consulting
Afflux Consulting is a specialist consultancy firm based in Melbourne, specialising in flood modelling. We consult on a large variety of projects which range greatly in size and complexity.
Our team has specialist expertise in applying the latest flood modelling techniques. This assists us in modelling real-world situations of rainfall being converted into runoff and then flowing to receiving waterways and rivers.
We use our expert knowledge combined with the most reliable available data, the latest science, and high-end computer programs to understand and make sense of flooding issues.
Why were the maps generated?
We need maps that show how water moves in the areas where our sites are located, so our engineers and community can better understand flooding. A solid understanding of flood behaviours can be used for many purposes ranging from communication, emergency planning and response to infrastructure design and development approvals.
How are the maps generated?
The maps are a computer generated simulation of rainfall being applied to a large catchment area with diverse surfaces, complex terrain and a range of infrastructure throughout. They are based on millions of calculations and rely on the use of computer software tools to make this manageable.
The models estimate how much water is in rural creeks and streams by considering how the land is used and what we know about other areas in Gippsland. These estimations have been made for both small and large events to ensure we properly understand water flows in the area. These streamflow values are applied to streams at key locations at the top of the study area.
Within the study area, the computer simulation uses Direct Rainfall applied to the modelling (land) surfaces. There are many steps in preparing the various data inputs and processing of results, which are broadly described in the sections below.
Rainfall

Rainfall is applied evenly across the model area and varies with intensity over the length of the storm. The modelling approach replicates this behaviour, and for validation purposes, rainfall from the Morwell gauge has been used for actual storm events that occurred in 2011 and 2021, as described in the sections below.
Catchment Parameters
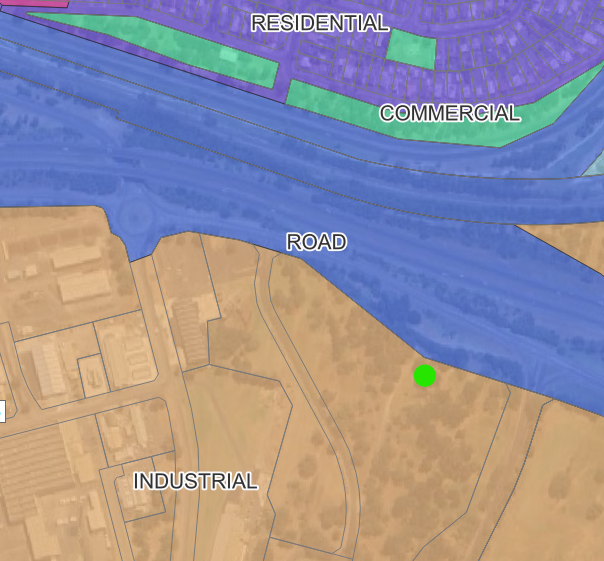
Different surfaces in a catchment influence how much rainfall is turned into runoff. For example, paved areas such as roads will generate more runoff than area than areas where water is able to soak into the ground, such as fields and paddocks. Based on the Planning scheme, different catchment areas are assigned different parameters that affect the amount of runoff and how easily this is able to flow through the catchment.
Significant catchment factors that are likely to influence the behaviour of runoff have been included, and include water courses, bridges, culverts under major roads and buildings and underground pipes in highly urbanised areas.
Terrain Model
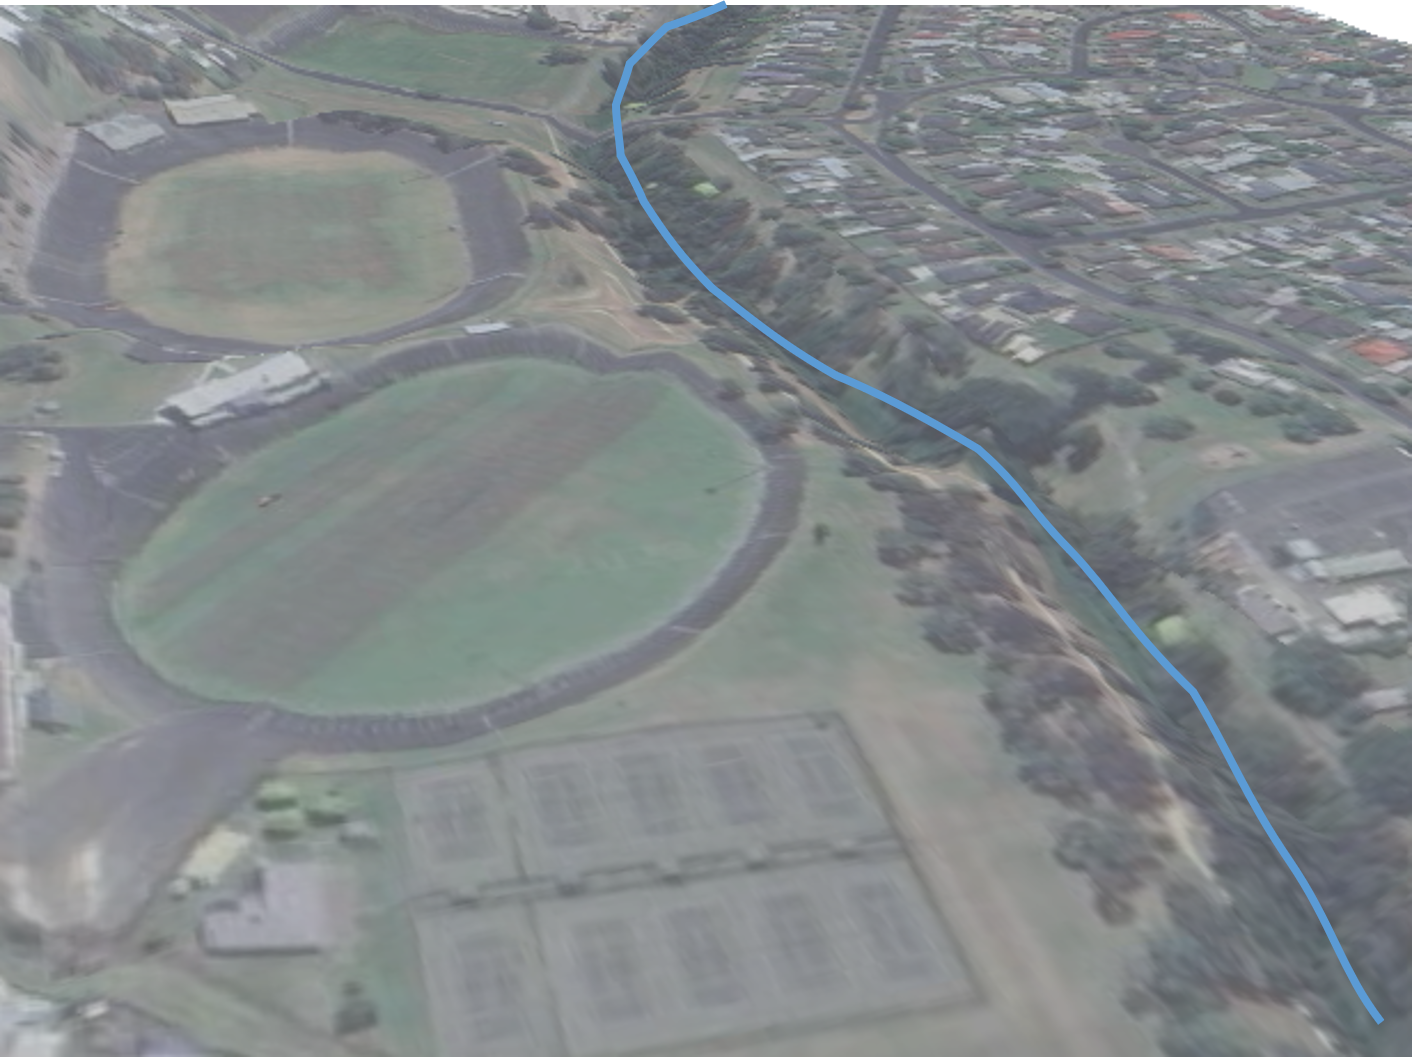
For urban areas, the council pipe network has been included based on asset information supplied. The pipe network has been checked to ensure it slopes downhill and functions hydraulically. Where relevant, the pits have been included to allow water to drain into the pipe network and sometime surcharge (i.e. flow out).
Pits and pipes
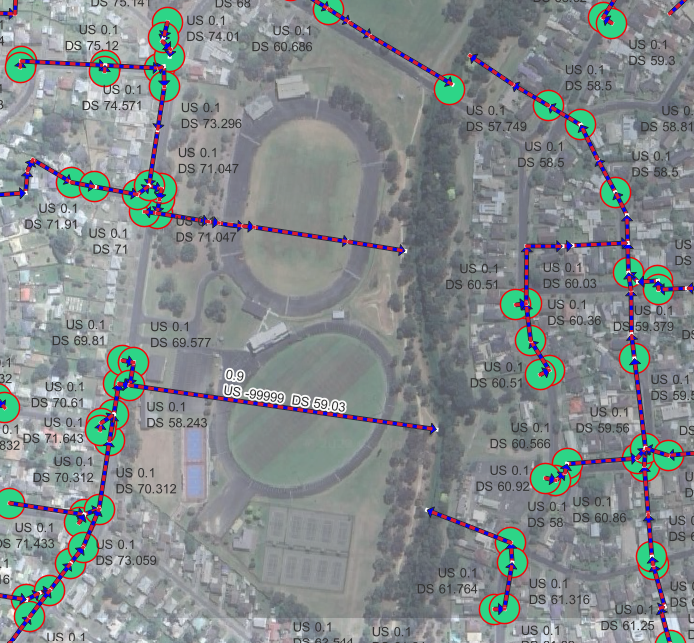
There are around 3,500 Council pipes in the study area, which ultimately drain into the local watercourses. Information on these pipes' location, size and level has been generated from Council's asset information system and topography to ensure the pipes run downhill.
Buildings
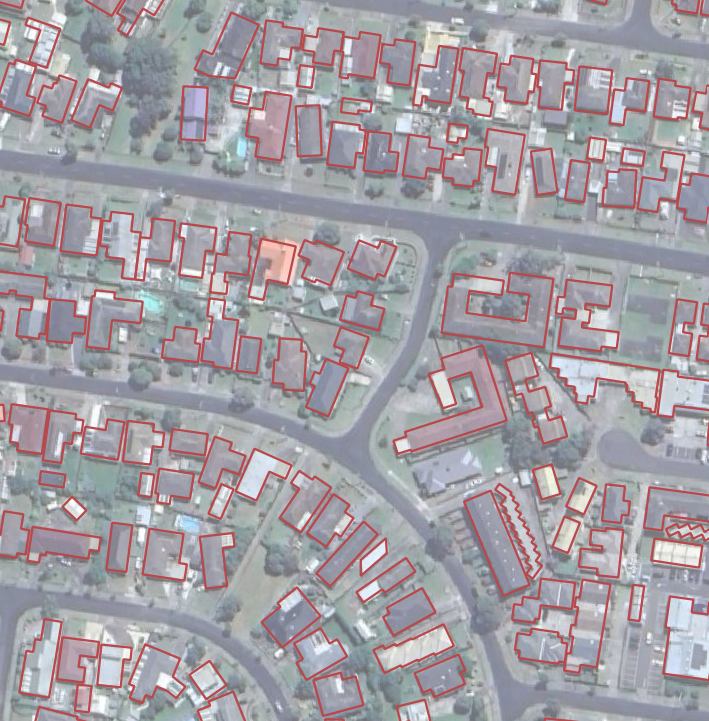
Buildings can have a major impact on the direction of flow in highly urbanised areas as water has to flow around them. This can influence the direction of flow and therefore impacts downstream on neighbouring properties. Buildings have been included in the modelling to assist with a more realistic representation of runoff behaviour.
Calculation of flood levels
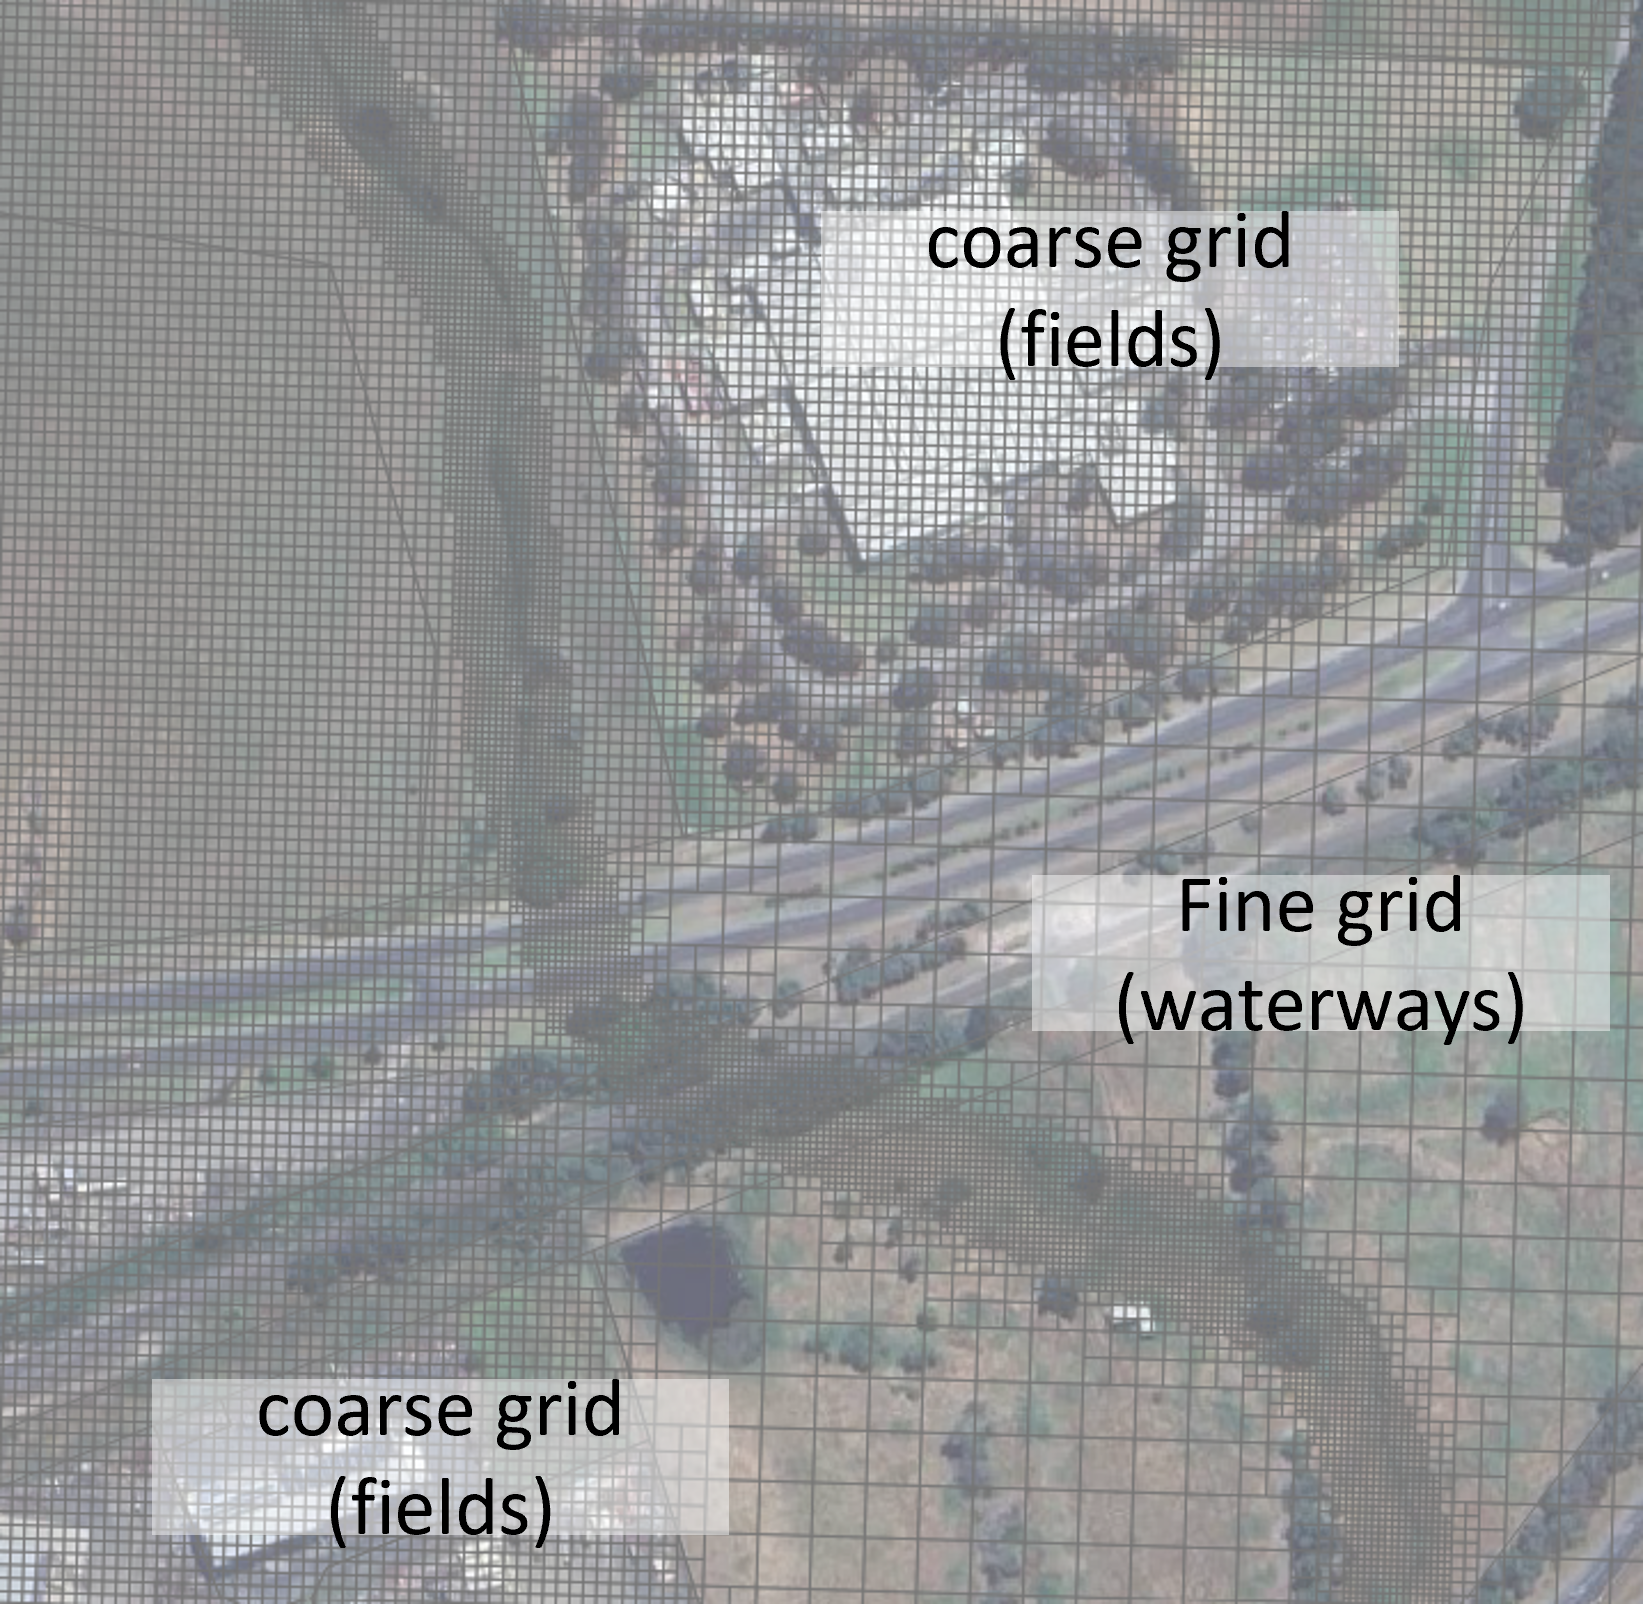
The entire model is broken up into thousands of smaller parts (grids) to undertake calculations. In some areas (such as open fields), the grid size can be larger without affecting the calculation process; in other areas (such as urban settings or along water courses), the grid sizes have to be much finer to incorporate small changes in ground elevation and provide a more accurate representation of runoff behaviour. Our model uses a range of grid sizes from large (10 metres) for flatter areas down to 2 metres along watercourses.
Model refinement (Thinning of puddles)
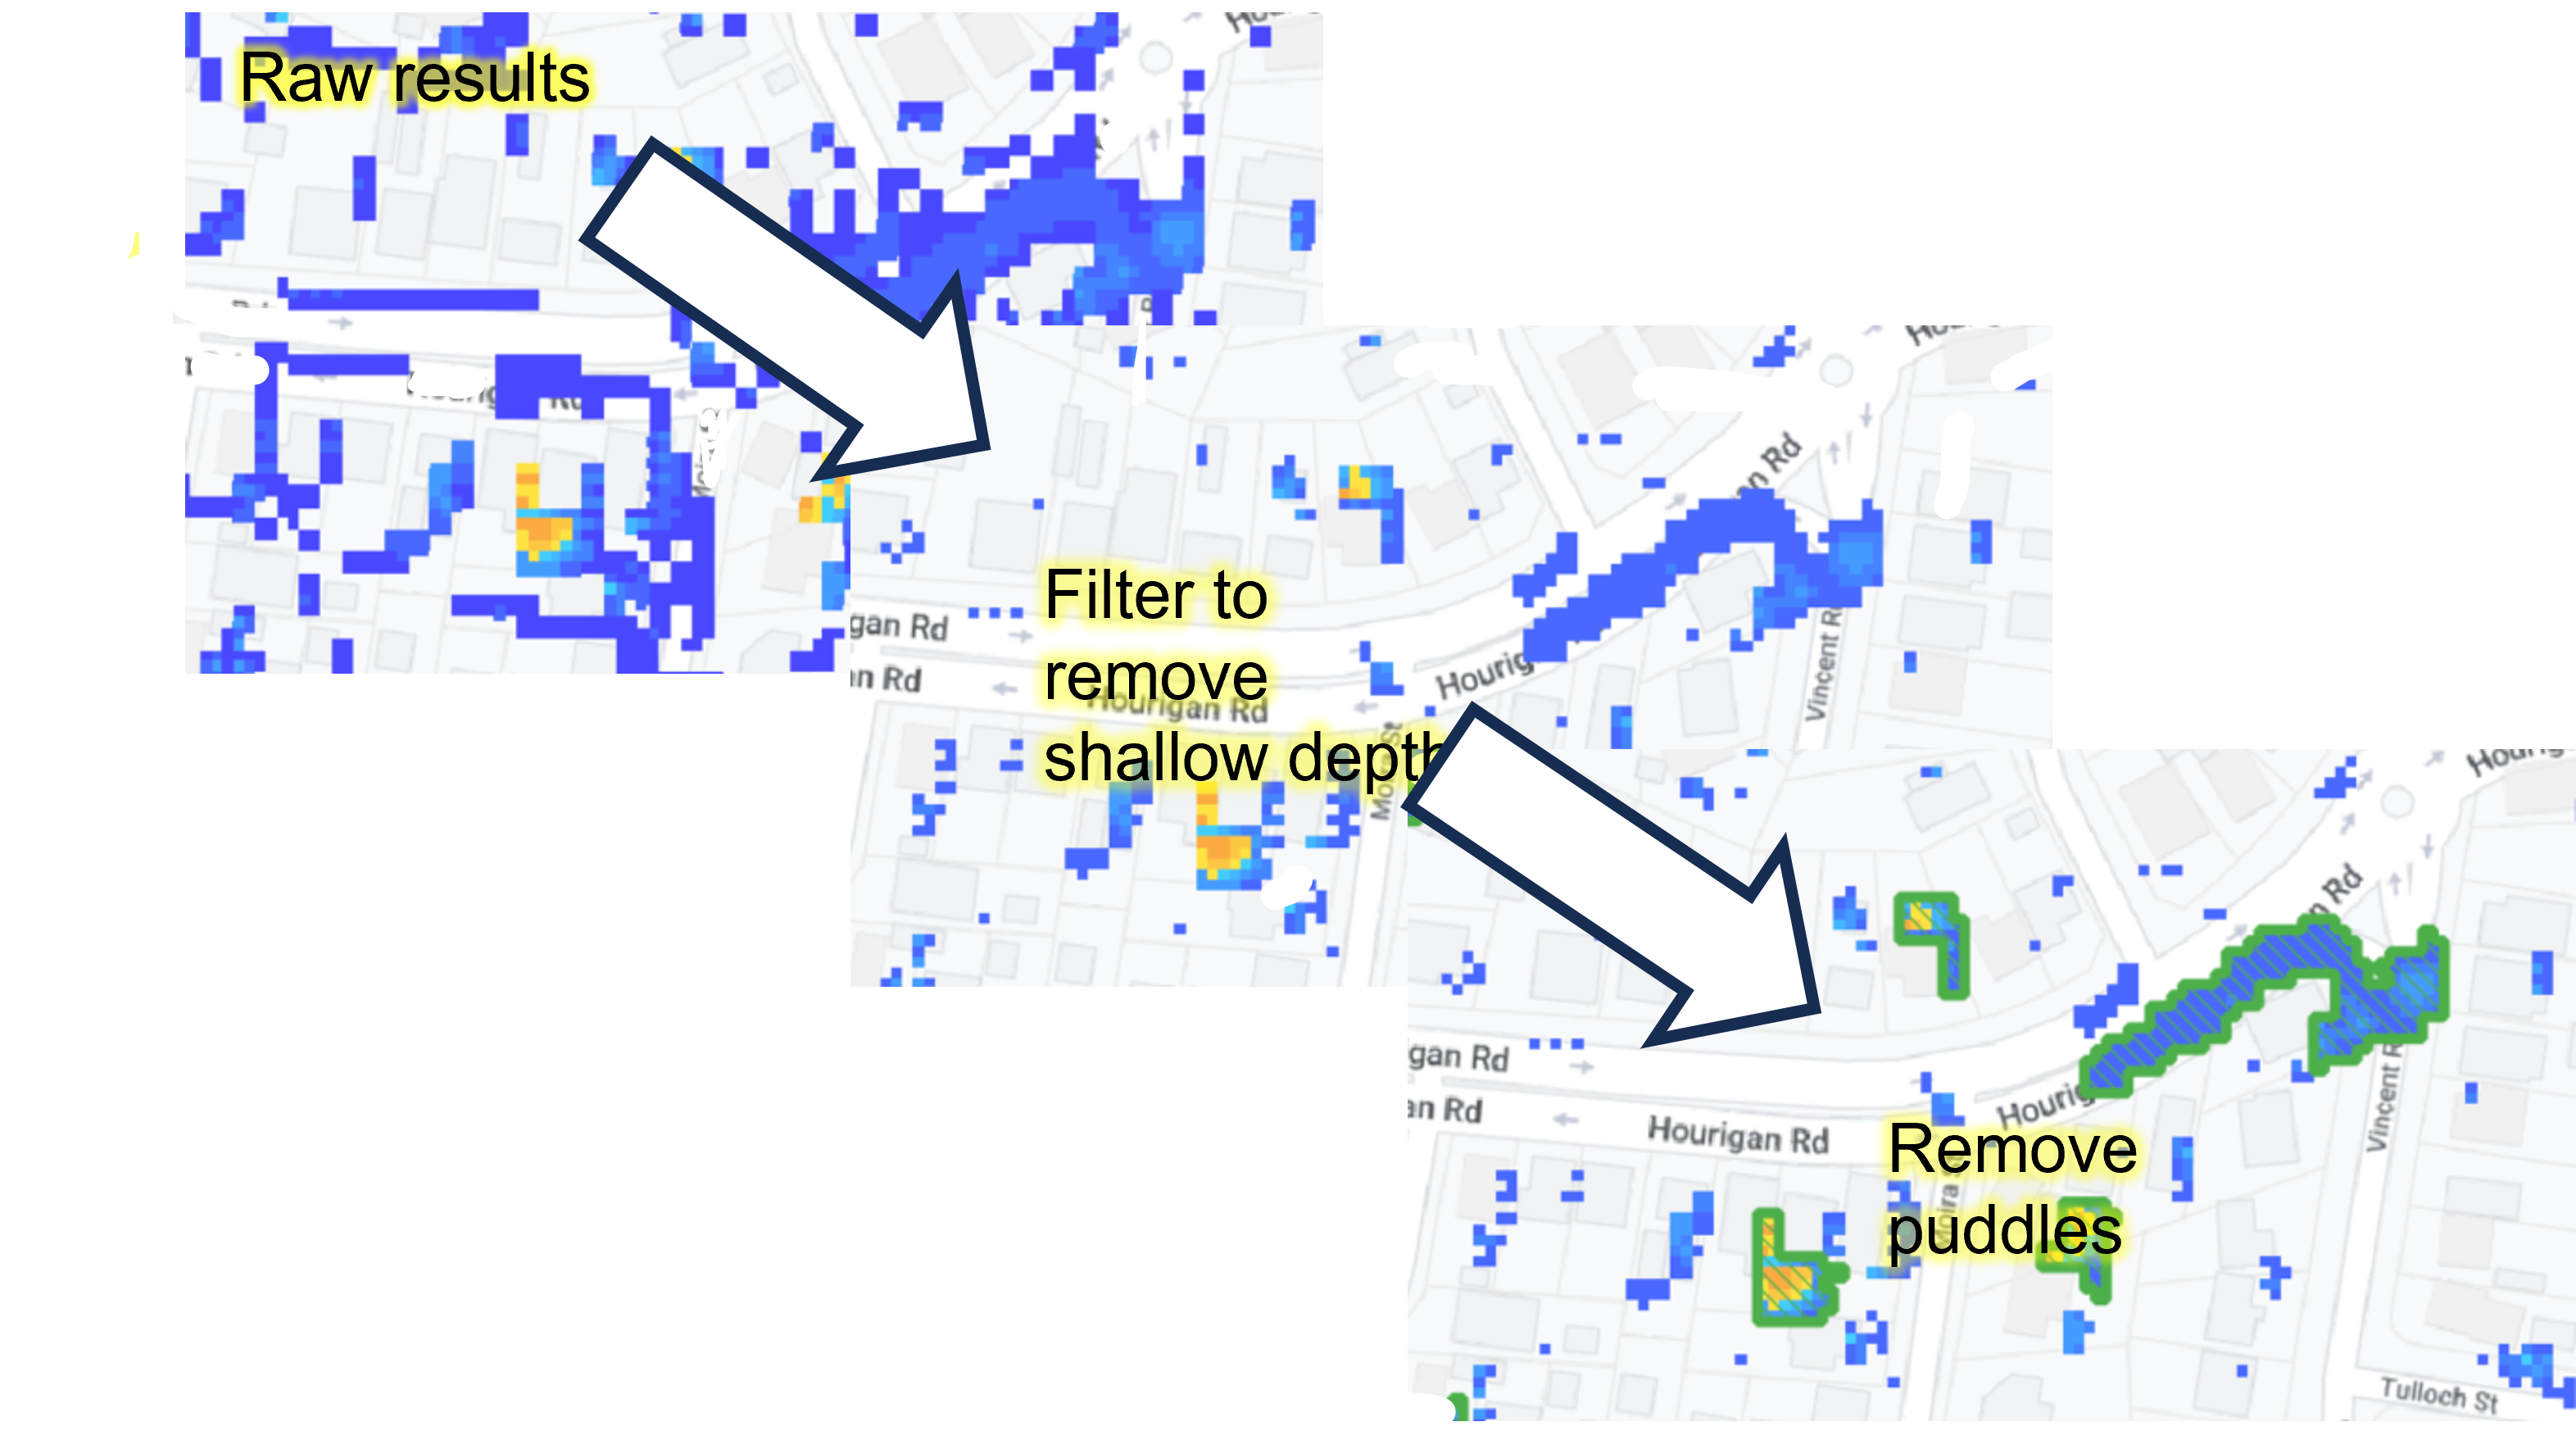
Once run, preliminary results include a lot of ‘noise’, usually where small amounts of water become ‘trapped’ on the thousands of grids used in the model. This needs to be cleaned up to produce representative maps, and a thinning process is used to remove smaller, isolated areas of shallow water that are likely of no real consequence. The current results have had smaller areas of water and depths of less than 2cm removed. Feedback through the validation process will assist in determining if this level of thinning is appropriate.
What storm events have been modelled?
Two storm events have been modelled. Local rainfall has been extracted from the Morwell gauge and streamflow based on an assessment of the significance of these rainfall events.
The event in 2021 occurred in May 2011 and lasted several days, with separate rainfall bursts occurring around 24 hours apart. In total, 60 mm of rainfall was recorded in the Morwell gauge.
The event in 2011 occurred in April 2011 and lasted for around 12 hours. In total, around 65mm was recorded in the Morwell gauge.

What is the purpose of validation?
It is impossible to model complex real-world interactions (such as flooding) with complete accuracy.
At each step in the process, there are judgements that need to be made on the information generated, and real-world feedback is an important step in the process. Engineers sitting in offices running computer models simply do not have the level of local knowledge that is needed to understand the extent and magnitude of flooding, and to avoid gross over- or under-estimations of impact.
Models should be seen as tools that can assist in technical understanding- they should provide sufficient information to avoid complete misunderstandings in flood behaviour, which can be refined with better information and higher levels of detail.
Validation of the modelling using recent storm events is an important part of the process. The selected events should be fresh enough in peoples’ memories that they can provide feedback.
What do Flood Depths Actually Mean?
The depth of flooding is usually the most tangible aspect of flood behaviour recognised by the community.
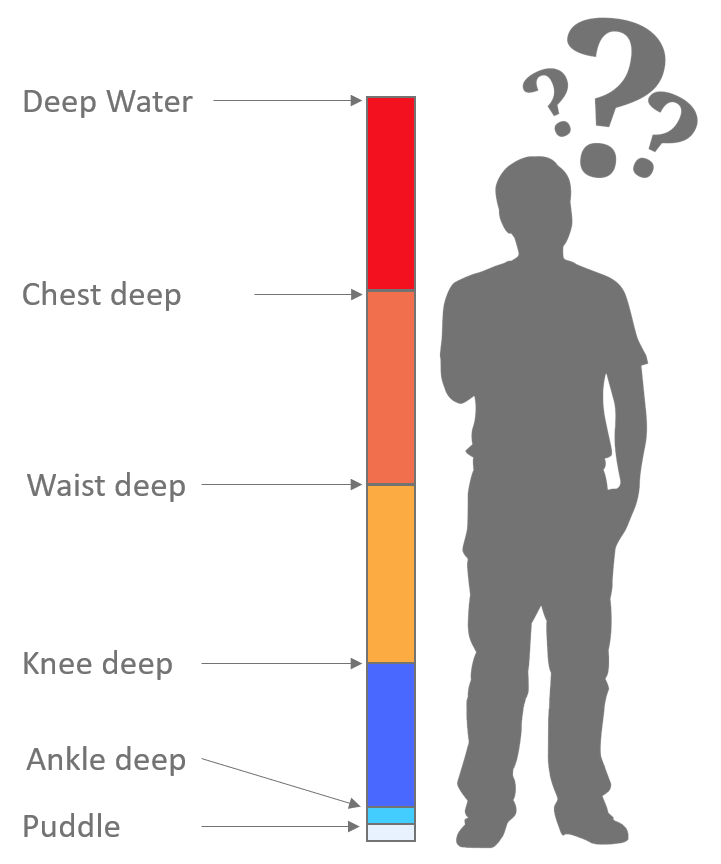
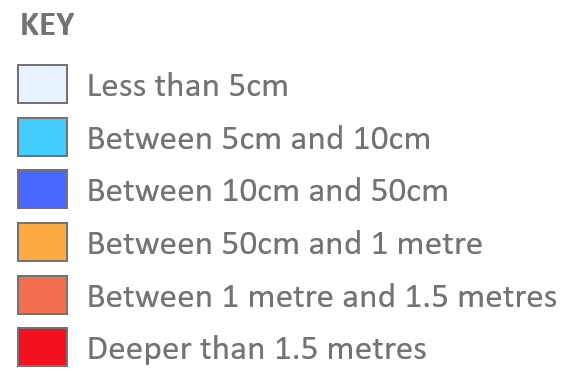
We have prepared the results for validation into distinct bands of depth and described these in relation to a typical adult. For the purposes of validation, we are less concerned about exact water depth and more about the general nature of flooding.
